You can log tickets in two available ways in Test Discovery. Let us discuss them one by one below:
The developer will fix the logged bugs, and the Ticket will be closed once the feature is ready to use without posing any errors.
With the first way, you'll have to go to the Analyze tab, click on the respective ERP and view the Activities tab corresponding to the selected scenario, on the right pane for the Execution Results.
To Log a Ticket for any failed script, the user will have to click on the three dots and select the option of Log a Ticket.
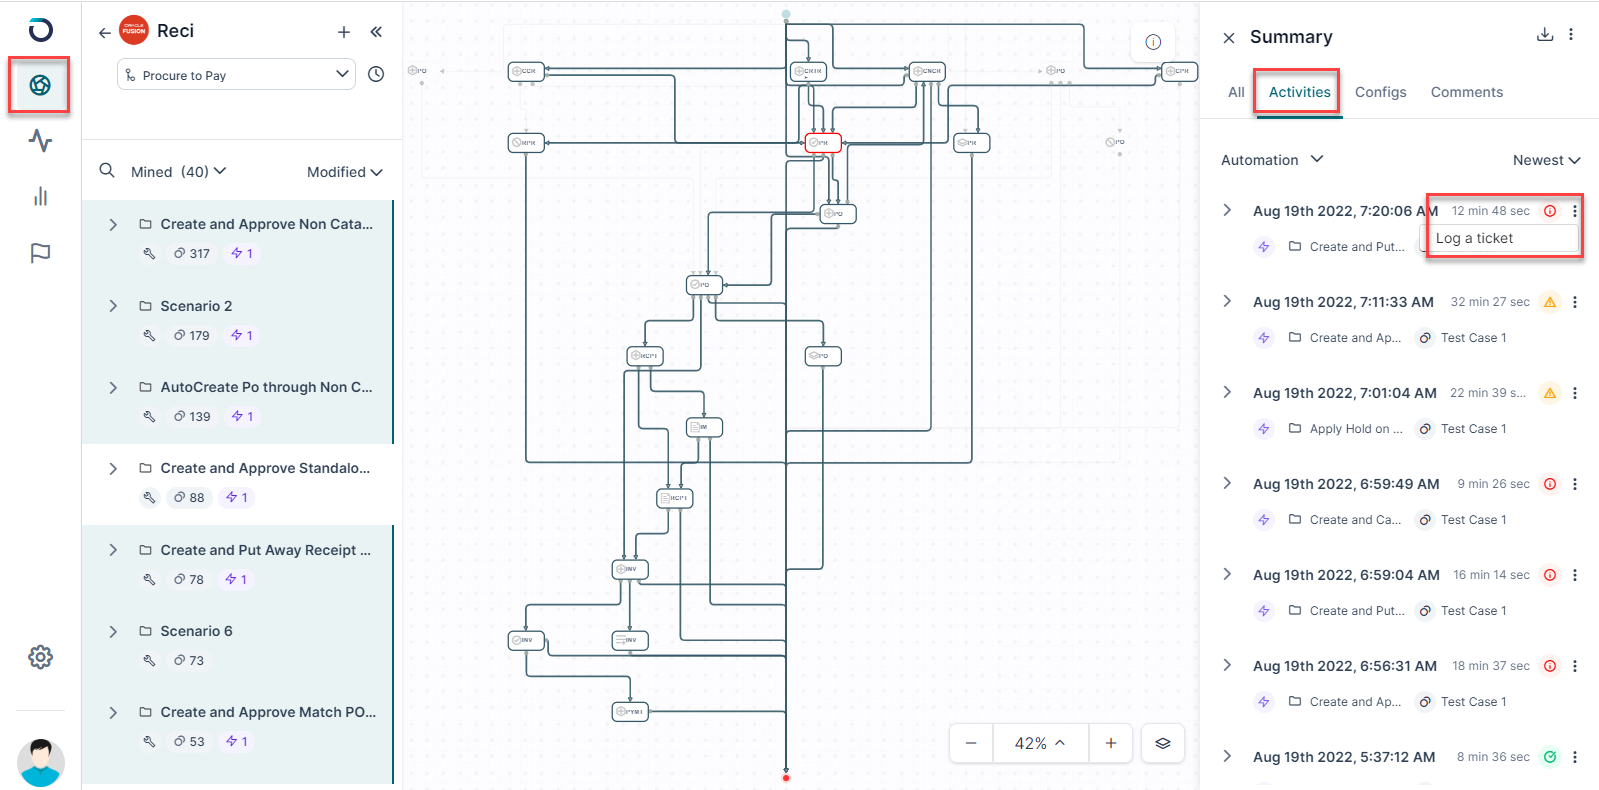
On Clicking the button of Log a Ticket, you’ll be able to view a pop-up window.
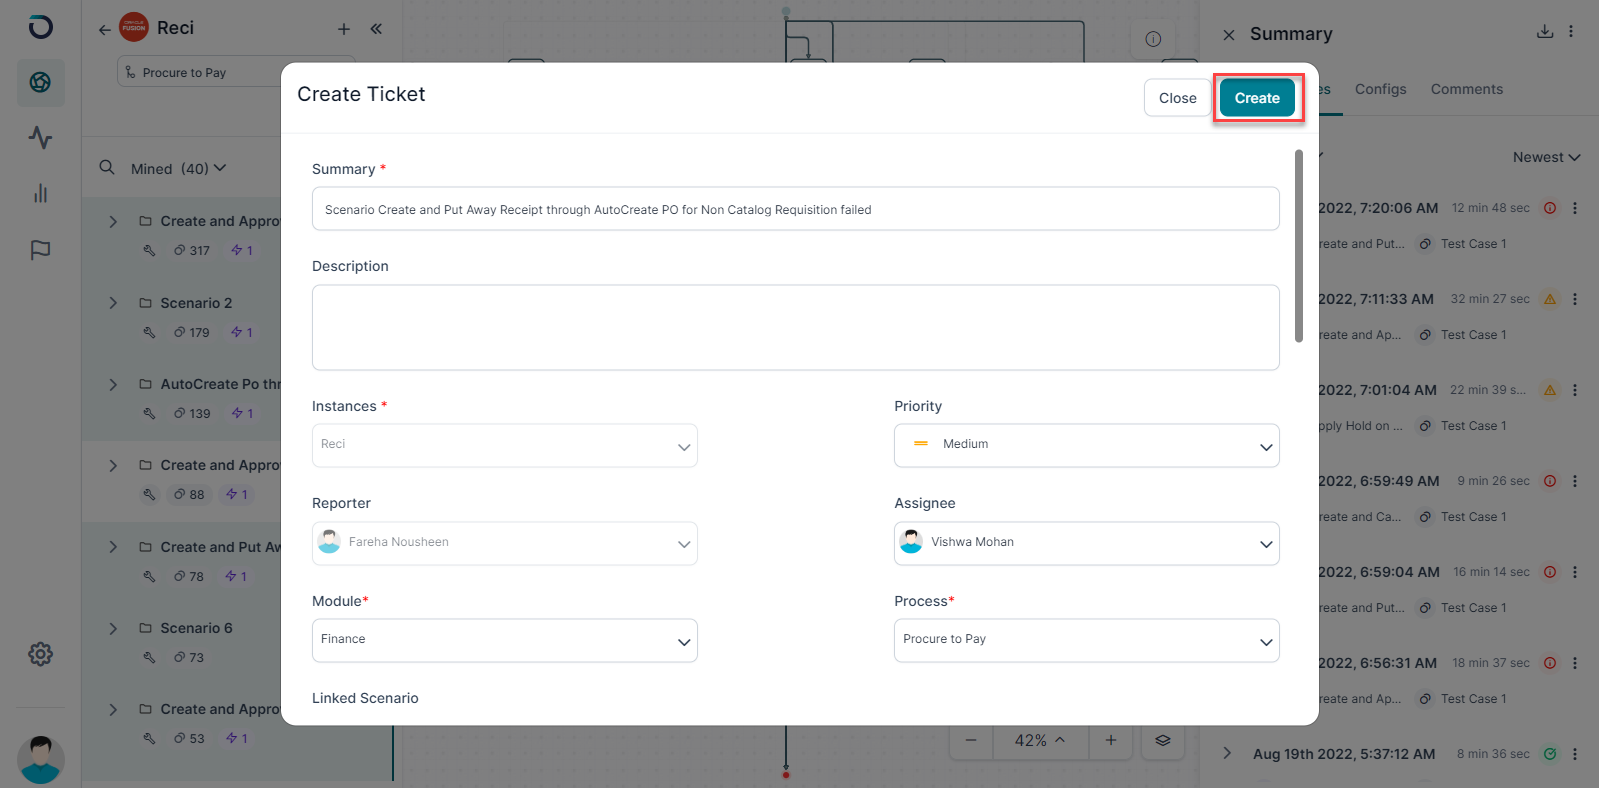
You’ll have to enter all the details on the fields required and click on the Create button.
The tickets will get created and will be visible on the right pane under the Activities tab.

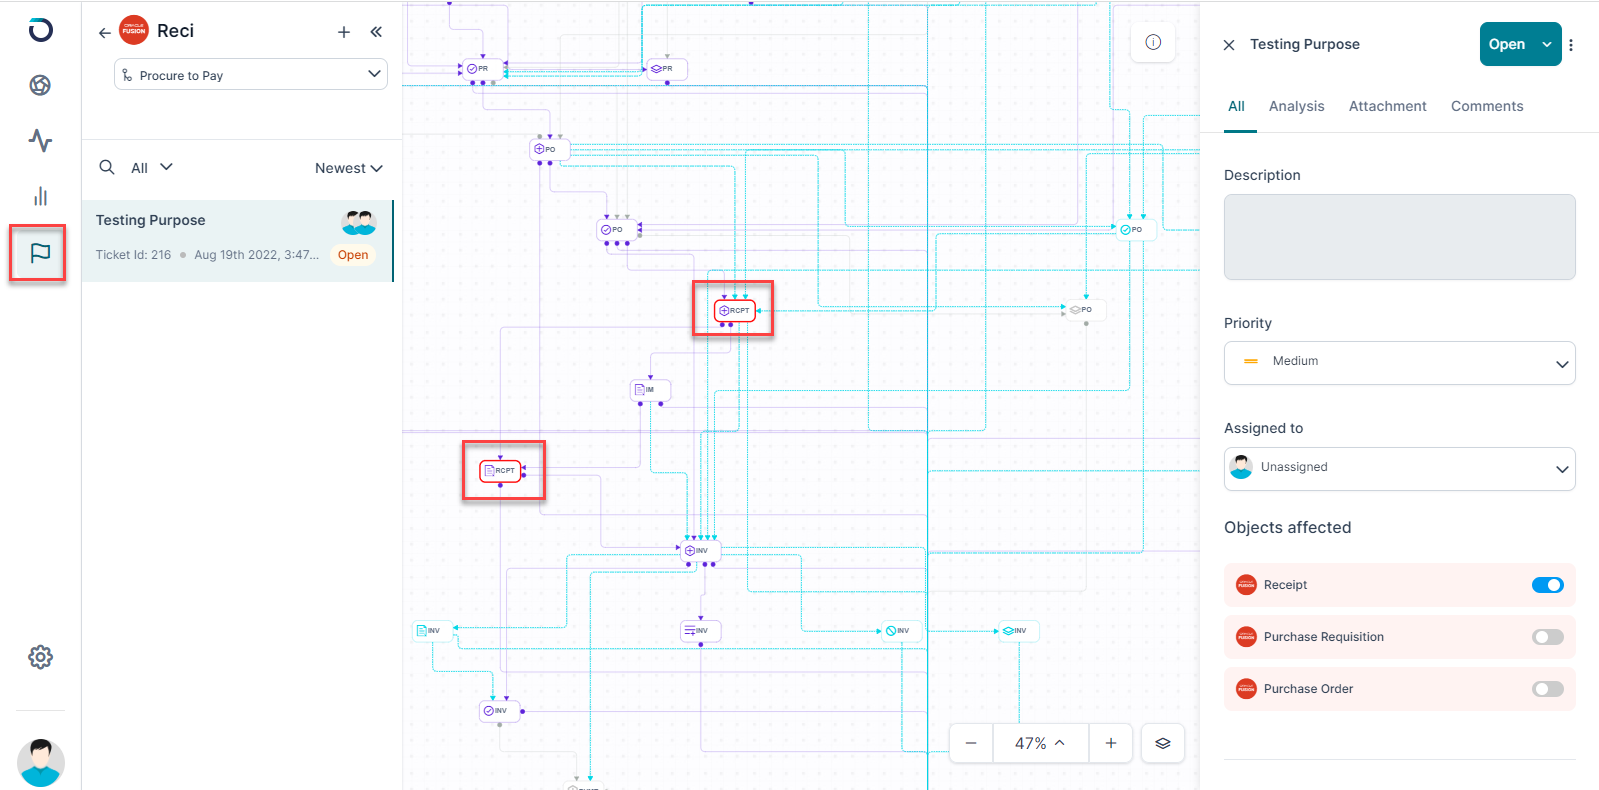
You can now go to the Tickets tab and view the created tickets.
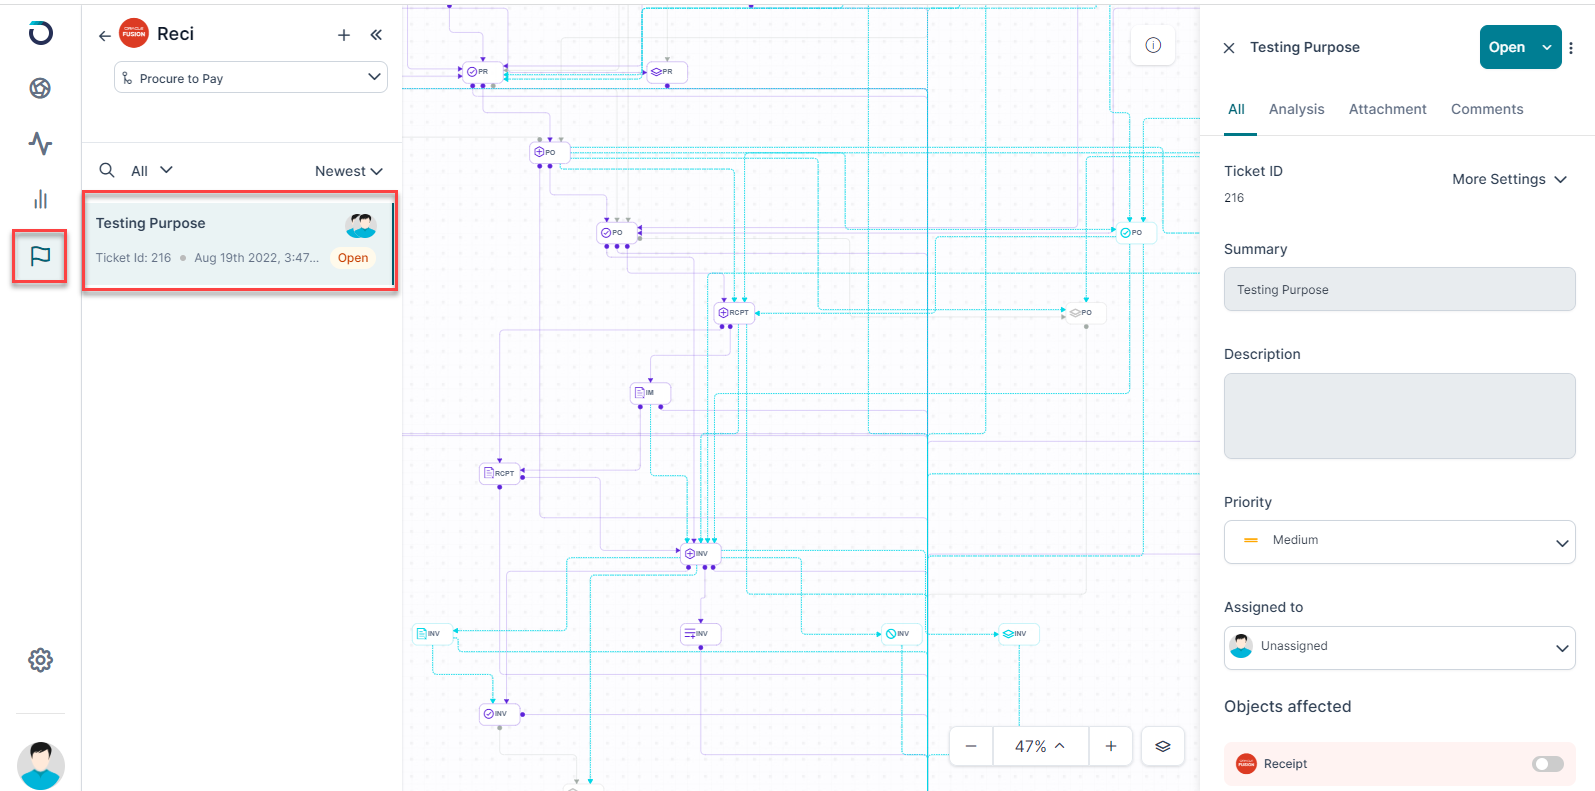
You can view the graphical representation of the tickets on the canvas.
On the right pane you can view the details of the logged ticket under All tabs.
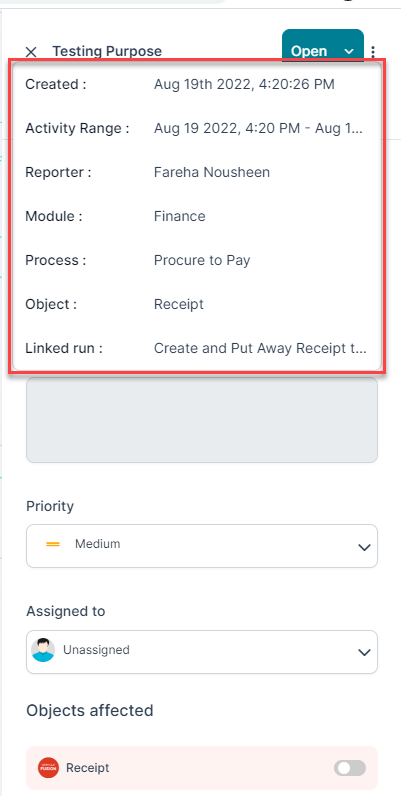
The three dots on the right hand corner will display the details as shown in the image below.
Below that it will have the Ticket ID and More Settings tab.
Under More Settings tab you can view the three categories of:
- Link to External Tool
- Escalate to Oracle Fusion
- Create new Issue
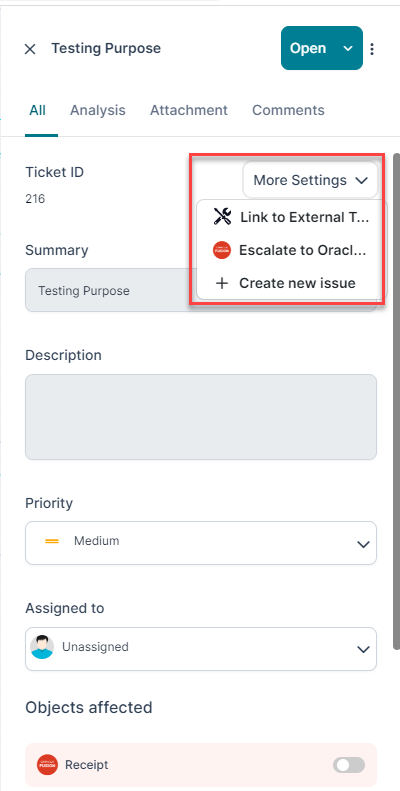
The Link to External Tool feature will allow you to maintain a copy of the the existing logged tickets of Opkey, on Jira too. This will allow the user to view the tickets on both platforms.
If you face any issue with the Oracle application, you can escalate the issue by notifying it. The Escalate it to Oracle Fusion tab will allow you to register the issue by filling the details on the available page.
With the Create New Issue section you can generate a new ticket corresponding to the analyzed process.
The following sections are of Summary and Description where you can edit their details.
The Priority section will let you know about the Priority of the registered issue.
The Assigned To section will display the name of the person to whom the ticket is assigned to.
The last section is of Objects Affected. On toggling the button it will highlight the Objects on the canvas.
Next to All tab, is the Analysis tab.
The first section is of Objects Affected which when selected will display to you the details if the affected objects.
The section following is of Field Comparison
Here you’ll have to select the field available in the form column corresponding to which you can view the comparisons of those selected fields below.
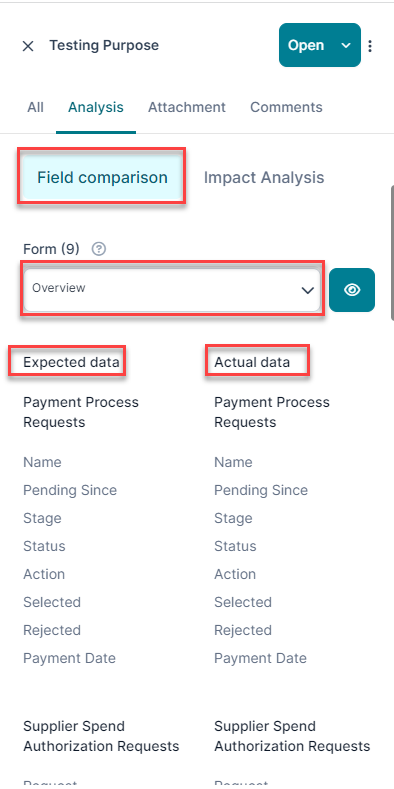
The retrieved data will display the details of Expected Data and Actual Data.
The Eye button next to the forms column will open up a new window that will also display the Actual Data and Expected Data.

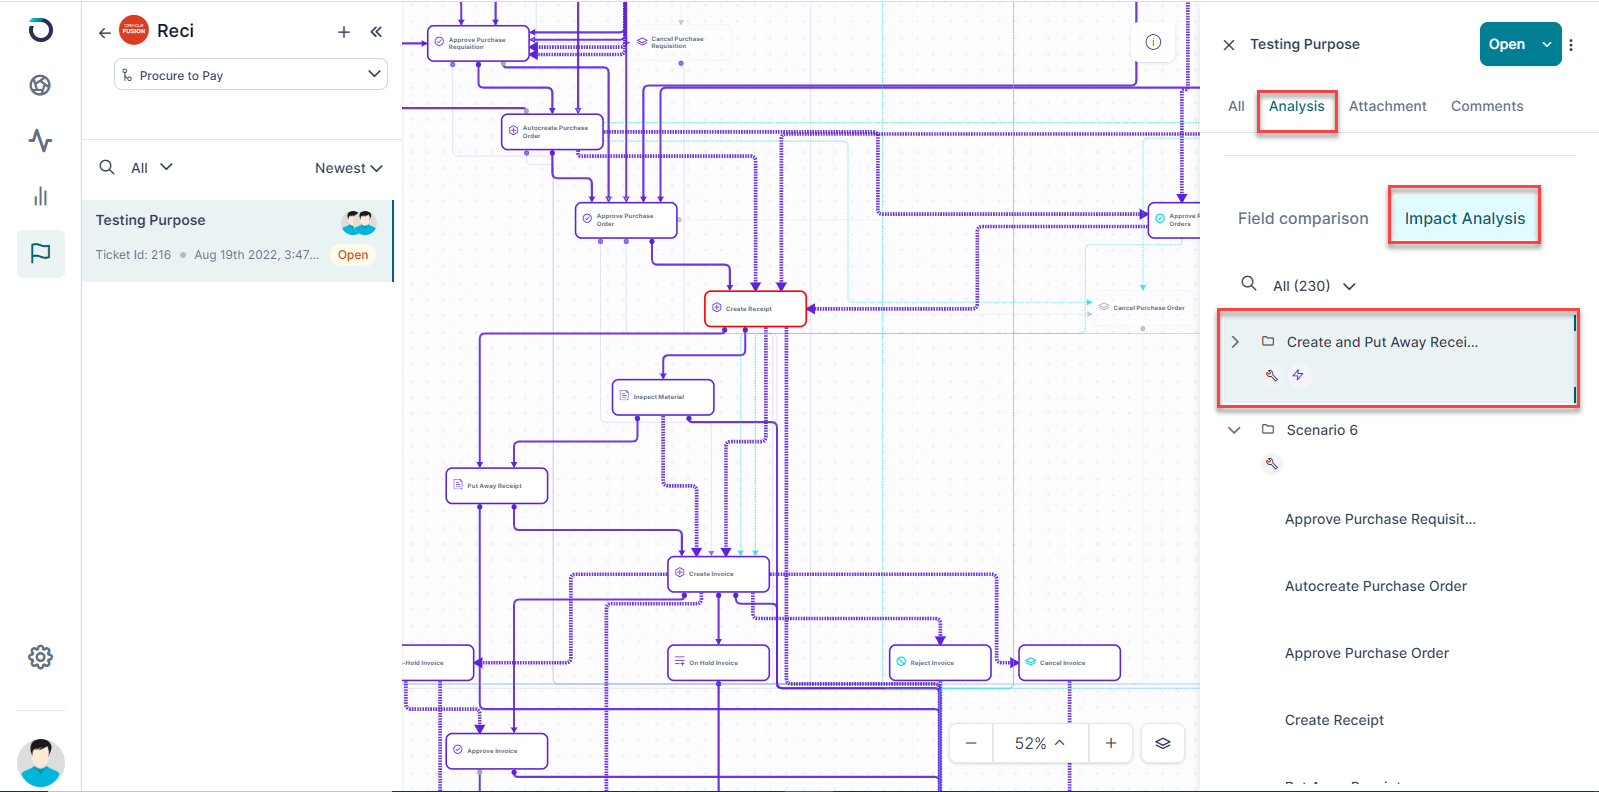
The tab adjacent to Field Comparison is of Impact Analysis. You can select the category of Scenarios by clicking on the dropdown and proceed to view the Impacted objects in the scenarios in the canvas.
The third tab is of Attachment, which will let you attach any file related to the logged ticket.
In the Comments section, you can comment on any task which needs attention.