The Test Run Report will provide all the test run details in the reports of all the present scenarios and of the test cases based on test run selection.
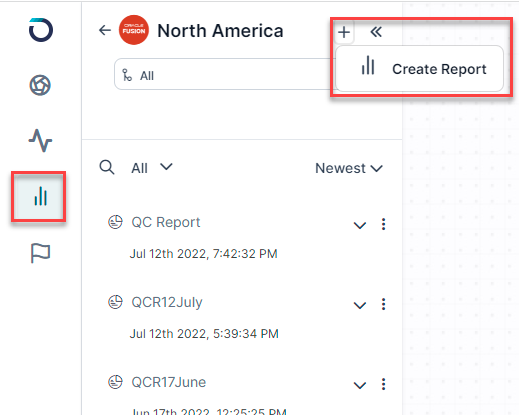
To create the Test Run Report the user will have to select the Create Report tab.
From the drop-down on the pop-up, the Test Run Report will have to be selected and the details have to be filled in.
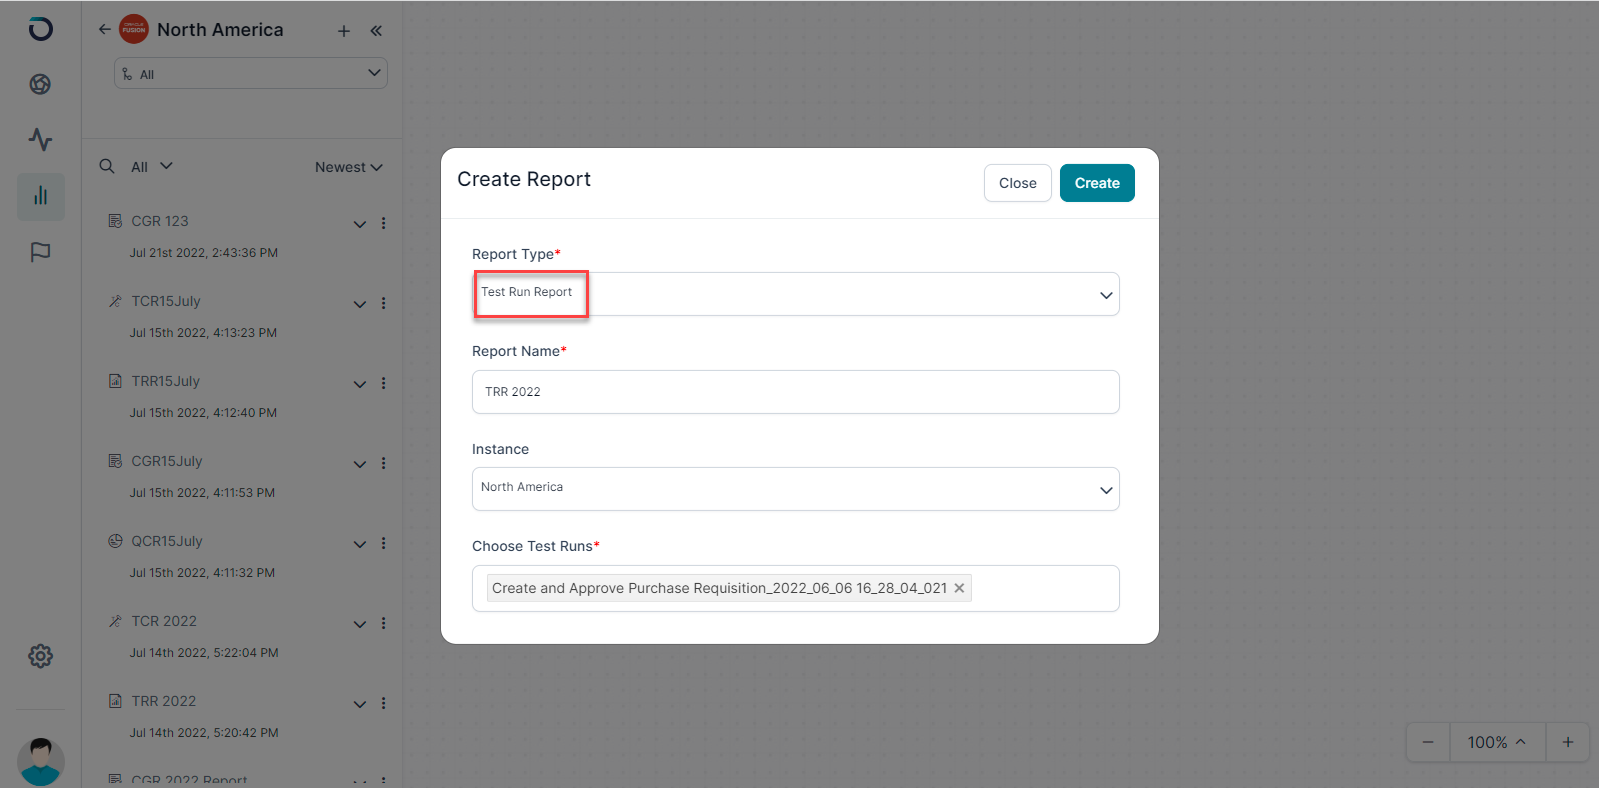
Once all the details have been filled, the user will have to generate the Test Run Report by clicking on the Create button.
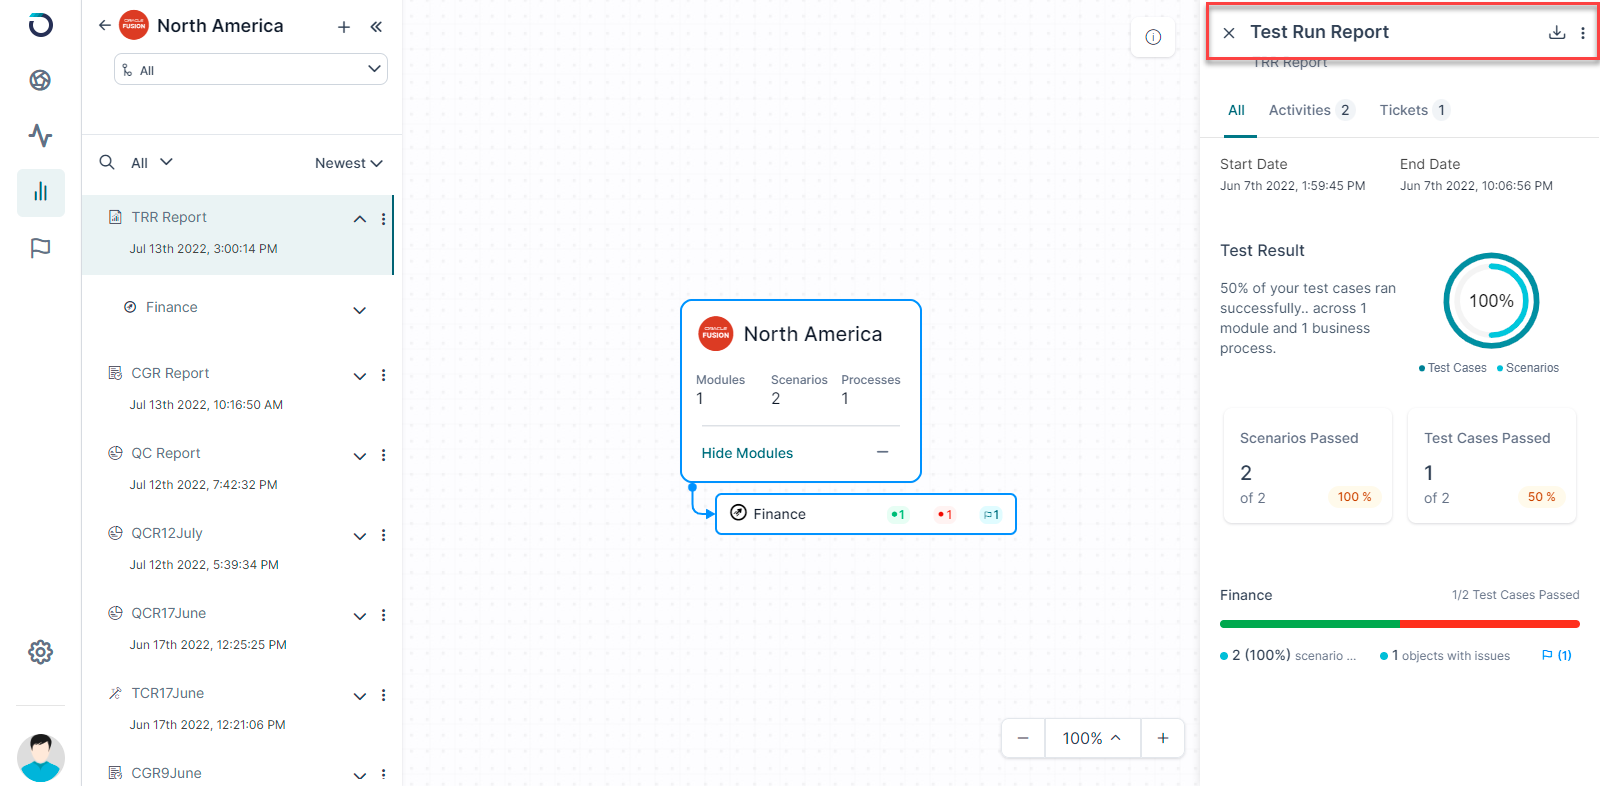
Once the report gets generated you can view the Report and its details in the right pane. Under the All tab the first section is of Start date and End date which notifies about the Start date and End date in which the analysis has been done.
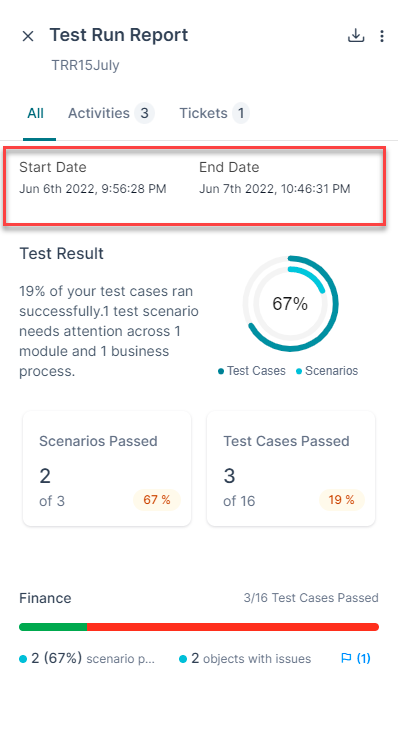
The next section is of Test Result which notifies about the percentage of Scenarios and Test cases that are passed and the percentage that needs attention.
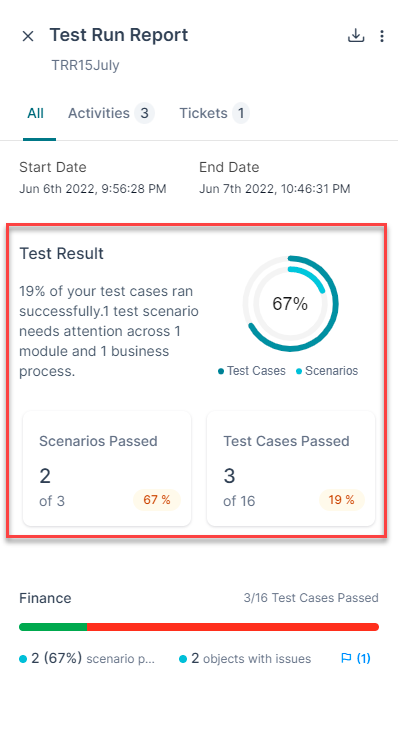
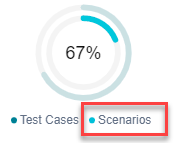
On hovering at the test case button, the colored part on the circle mentions about the test cases that have ran successfully.

Similarly on hovering at the scenarios, the light blue line mentions about the scenarios that ran successfully.
The last section under the All tabs mentions the details about the modules and their test cases and scenarios.
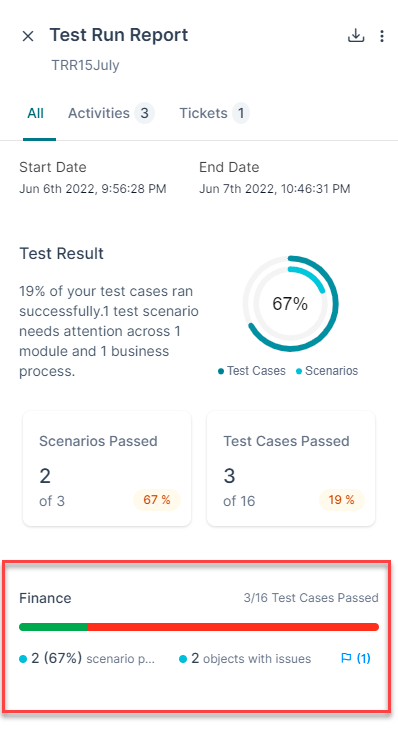
The light blue dots let you know about the passed scenarios.
The dark blue dots let you know about the objects with issues.
The flag button lets you view the logged tickets.
Under the activities tab, you’ll be able to view the details of the Application’s modules and its scenarios and test cases.
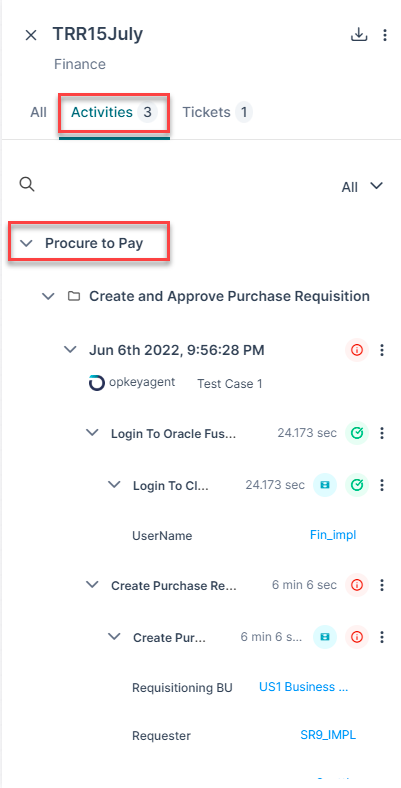
The drop-down present on the right side of the page will show you the categories in which the test cases are present under a scenario.

The three dots present on the adjacent right of the test cases will let you log a ticket.
The Red and Green buttons notify about the failed and passed test cases respectively.
Under the Tickets tab, under the Open section, you can filter out the test cases according to their status.

From the Newest dropdown, you can sort the test cases based on their creation dates.
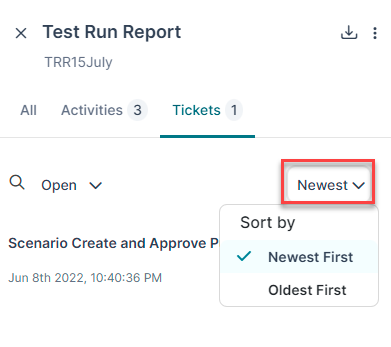
Once the sorting is done and the scenario is selected, you need to click on the respective scenario to know its further details.
It opens a new page which will have the Ticket ID on the left side and More Settings on the right.
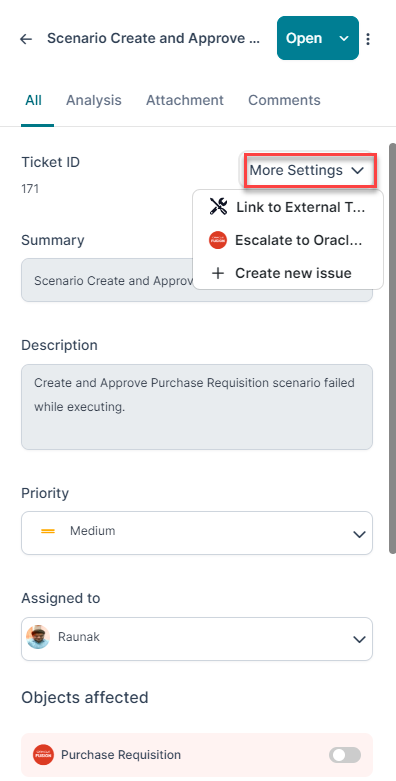
The dropdown on the More Setting tab is further divided into
Link to External Tool
Escalate to Oracle Fusion
Create a New Issue
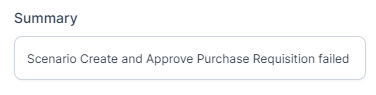
The Summary tab displays the status of scenarios whether they are passed or failed.
Description
The description tab displays the details of the executed scenario.

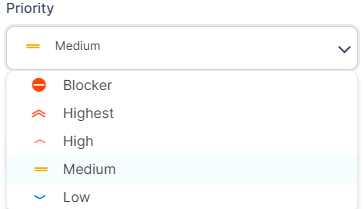
Priority
The Priority section lets you know about the state in which the Test case is assigned.
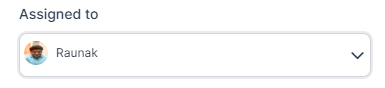
Assigned To
The Assigned to section lets you know who is assigned for the respective Ticket ID.
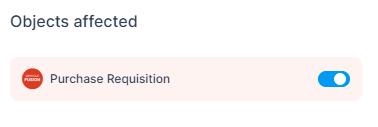
Objects Affected
The Objects Affected section lets you know about the Objects that are affected under a particular module.
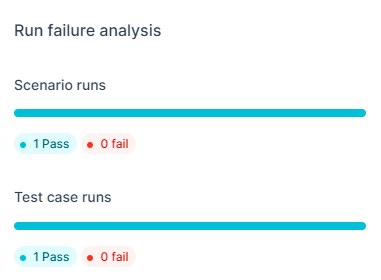
Run Failure Analysis
The last section on the page lets you know about the Run Failure Analysis of the scenarios and test cases of the respective module.
The next tab is of Analysis tab. Let’s take a look at the tabs under this section.
Objects Affected
This tab will display the objects that have been affected under a particular module.
Under the Field Comparison tab, you can view the forms under the dropdown.

The Eye tab adjacent to the form will give you the details of the Changed Impact details of the processes under a particular scenario.
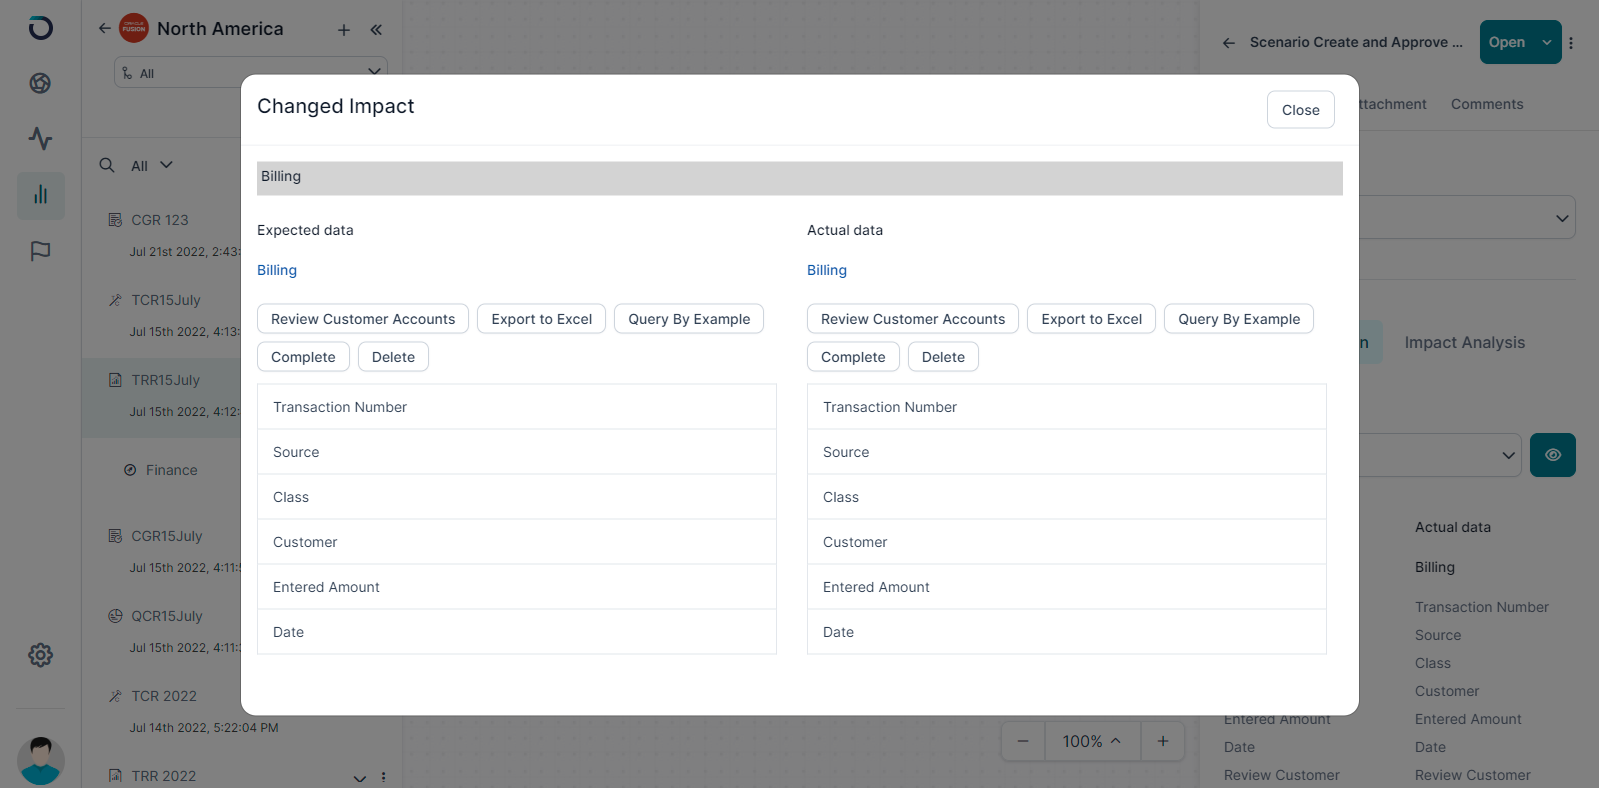
In one window you’ll be able to view the expected data and the actual data.
Under the Impact Analysis tab, you can filter out test cases according to the available categories:
Automated
Custom
Suggested
Mined

Post selecting the scenarios of a particular category, you can automate the test cases under that scenario.
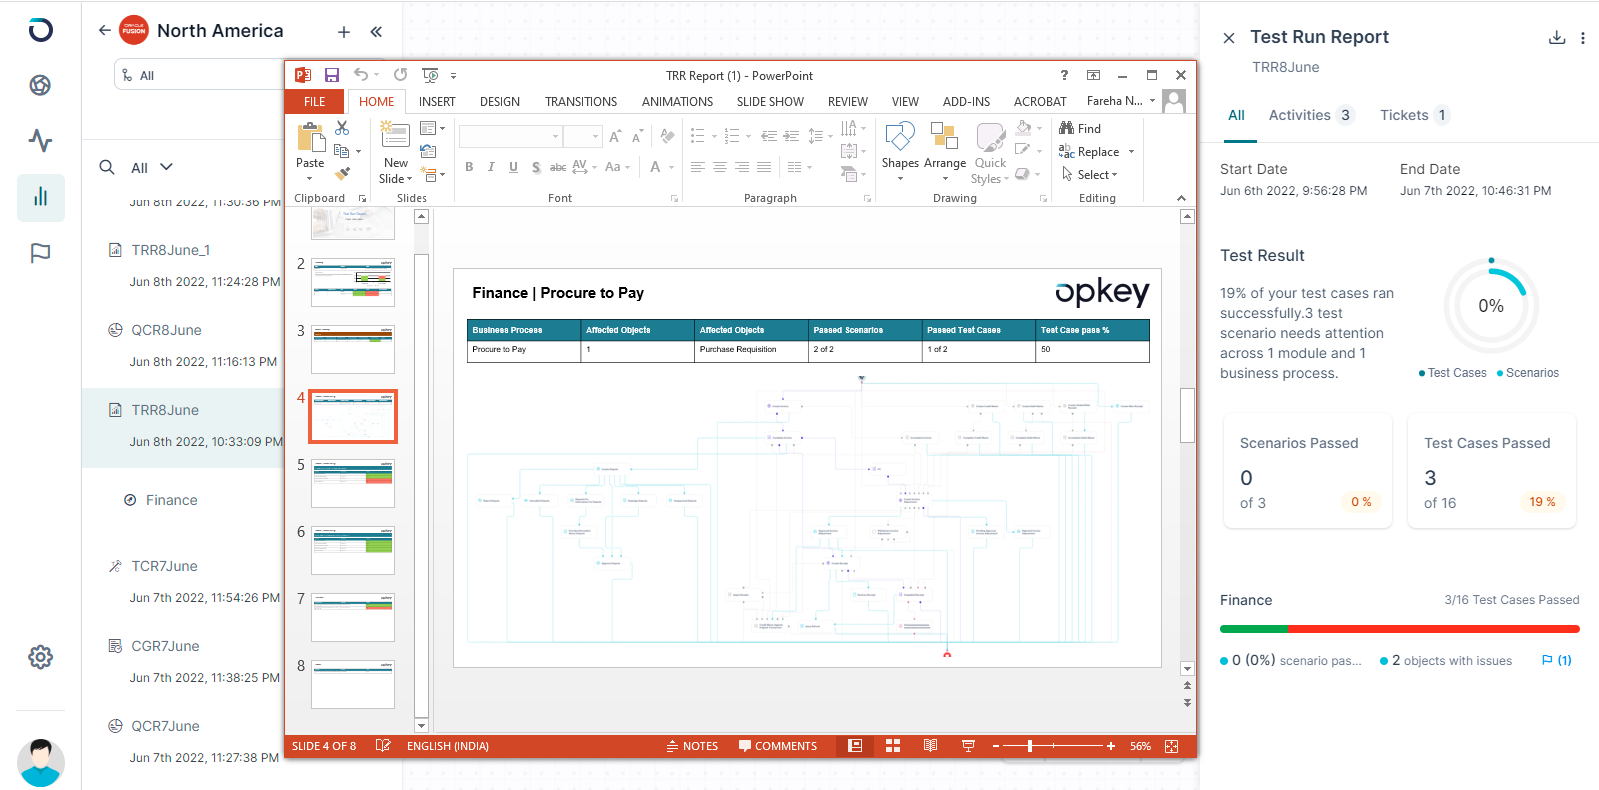
The middle section of the page will display the details of modules, scenarios, and processes in a particular instance.
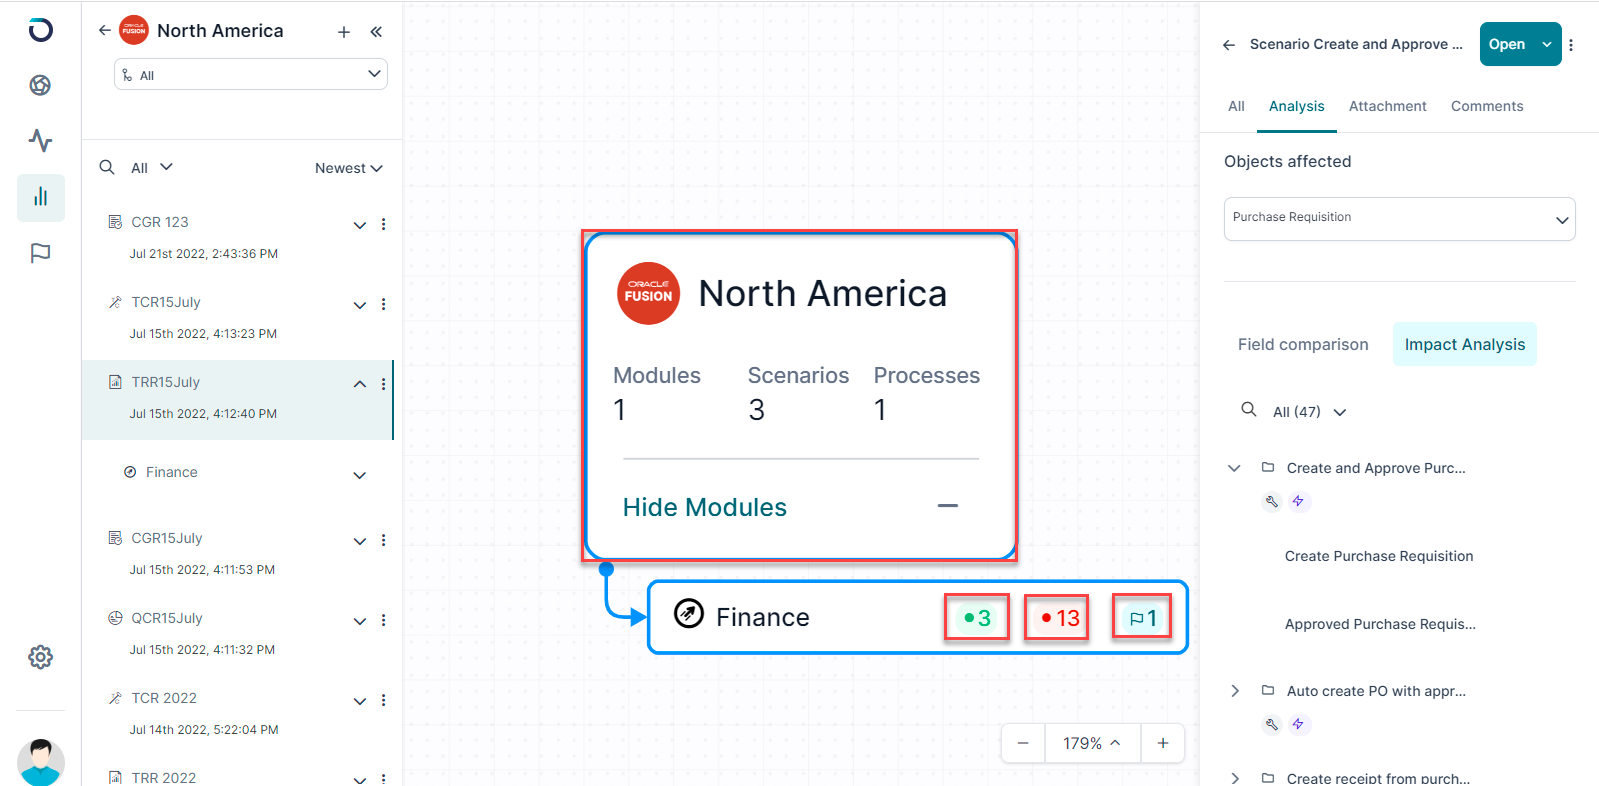
Under a particular module you can view the passed and failed test cases which is represented by red and green dots. The flag button notifies you about the total logged tickets.
Once the report gets generated, it can be downloaded from the arrow present on the left side of the page.
The download button is present on the right hand bottom corner of the page. The three dots present next to the downward arrow notifies you about the generated report.
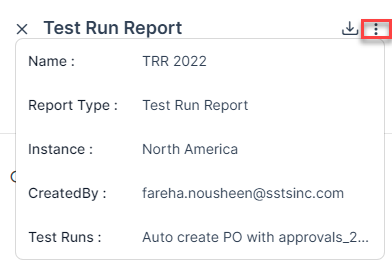
It will contain the
Name of the Report
Report Type
Instance
Created By
Test Runs
On clicking the downward arrow, the download in progress can be seen as below.

The report is downloaded in the PPT format and can be viewed on the page also.
The Test Run Report Summary will notify you about the passed and failed test cases in a particular module.
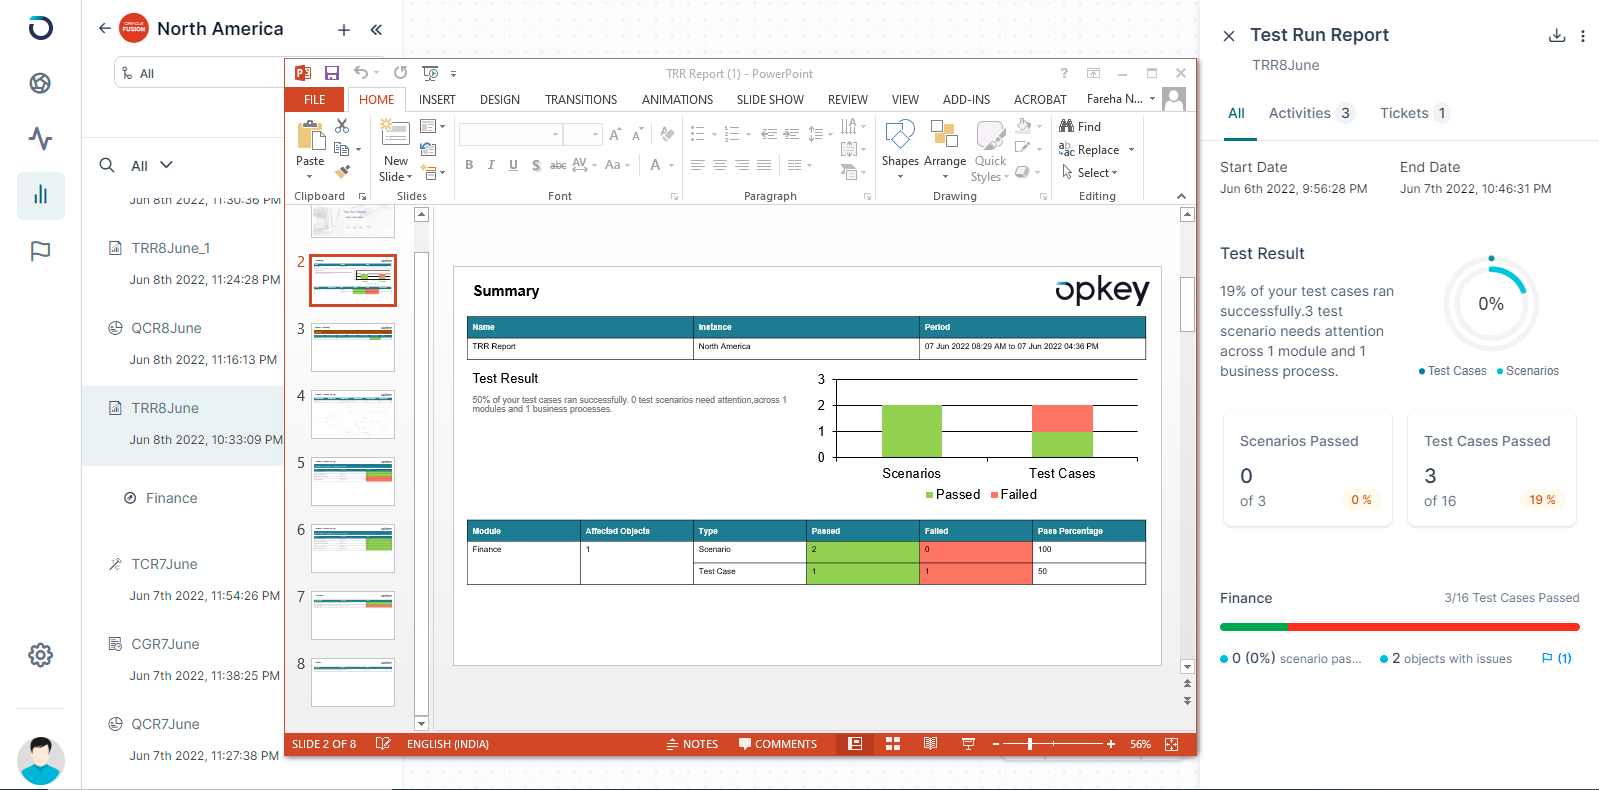
The Test Run Report graph will notify you about the details of test cases in a graphical manner.
The purple line denotes the details of the Automated test cases.
The Light blue lines denote the details of the Suggested test cases.