The Impact Analysis Report will allow the user to compare the two releases and then prepare the report.
It helps identify the areas to test and eliminate the time and expense of performing a regression test for every code update or change.
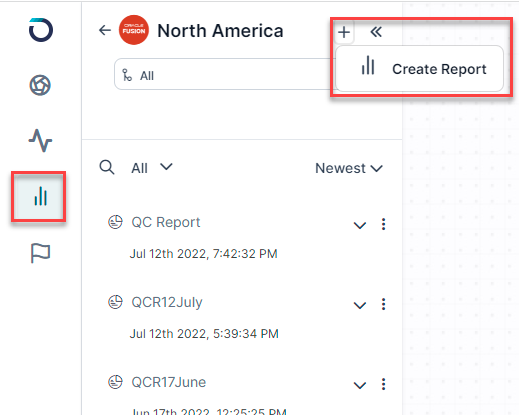
To create the Impact Analysis Report user will have to click on the create report option and select the Impact Analysis report from the dropdown
The user will have to enter details on the Pop-up menu.

Once the report gets generated, expand the report from its left pane to view the modules and their details.

The middle section of the page displays the selected modules, scenarios, and processes.
The right pane will have tabs for All and Analysis.
Under the All tab, the Impact Analysis section will display the percentage of Impacted Objects post the Release.

The following section under all tabs will display Object Analysis. It will have the details of Impacted Objects and Scenarios.

The last section will have the Affected Objects toggle button which will display the details in a graphical manner.

The graphs can be moved and verified to view the objects in detail.
Under the Analysis tab, you’ll be able to view the details of Objects affected and click on the dropdown to view the modules present.

The below section is of Field Comparison which will compare the selected fields and lets you view the Actual data and the Expected data.
The next section is the Impact Analysis tab which will let you view the Impacted Objects in the canvas.

You can Self Heal the scripts post Release by clicking on the button present on the Test Cases.

Post healing you can view those Impacted steps

……………………………………………………………………………………………………………..
Once the run is executed and the report gets generated you can download the report.

The generated report will have a summary of impacted modules and business processes.
The downloaded report will have the comparison of the pre and post-session data of the Test Cases of the cloud update.

You’ll be able to view the details of the affected ones as well as the unchanged cases of modules.
The details of the affected objects will also be displayed in the chart form..

The graphical representation of data will provide a clear view of the impacted test cases.
